고정 헤더 영역
상세 컨텐츠
본문
반응형
(*This is the ch.14 of "Patterns of Democracy" by Arend Lijphart)
In this brief chapter I summarize the main findings of Chapters 5 through 13, which have dealt with each of the ten basic majoritarian versus consensus variables. I focus on two as pects of the “grand picture”: the two-dimensional pattern formed by the relationships among the ten variables and the positions of each of the thirty-six democracies in this two-dimensional pattern. In addition, I explore the changes in these positions from the pre-1980 to the post-1981 period of twenty-seven of the thirty-six democracies for which a sufficiently long time span is available in the first period.
THE TWO DIMENSIONS
In Chapter 1, I previewed one of the most important general findings of this book: the clustering of the ten institutional variables along two clearly separate dimensions, which I have called the executives-parties and federal-unitary dimensions—although, as I explained in Chapter 1, it might be more accurate and theoretically more meaningful to call the two dimensions the joint-power and divided-power dimensions. In Chapters 5 through 13, too, I have repeatedly called attention to the close links among some of the variables within each cluster. Table 14.1 now presents the overall pattern by means of the correlation matrix for all ten variables. It shows strong relationships within each cluster and only weak connections between variables belonging to different clusters. All of the correlations within the two clusters are statistically significant: fifteen of the twenty at the 1 percent level and the remaining five at the 5 percent level; the correlation coefficients are shown in the two highlighted triangles in Table 14.1. In sharp contrast, only one of the twenty-five correlations between variables in the different clusters, shown in the bottom left of the table, is large enough to be statistically significant, and only at the 5 percent level.
Correlation matrix of the ten variables distinguishing majoritarian from consensus democracy in thirty-six democracies, 1945–2010
---------------------------------------------------------------------------
Variable 1: Effective number of parliamentary parties
Variable 2: Minimal winning one-party cabinets
Variable 3: Executive dominance
Variable 4: Electoral disproportionality
Variable 5: Interest group pluralism
Variable 6: Federalism-decentralization
Variable 7: Bicameralism
Variable 8: Constitutional rigidity
Variable 9: Judicial review
Variable 10: Central bank independence
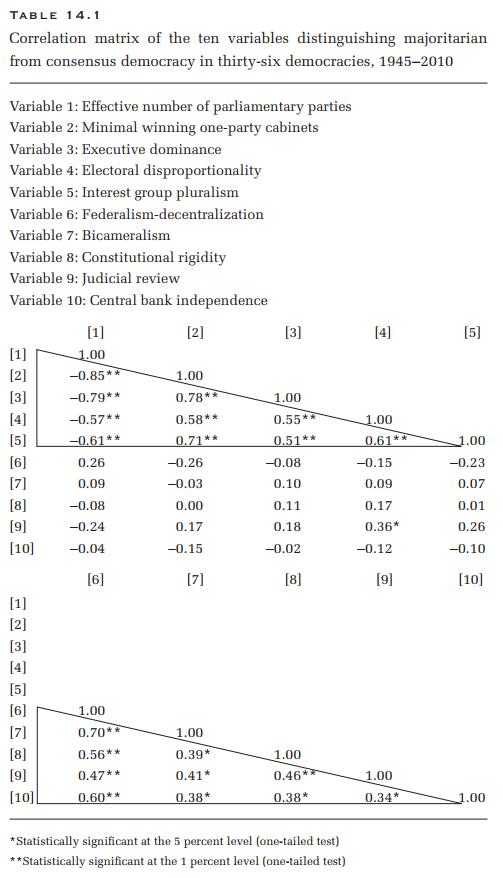
The first cluster of variables has somewhat stronger interconnections than the second cluster: the averages of the absolute values of the correlation coefficients are 0.66 and 0.47, respectively. Within the first cluster, the percentage of minimal winning oneparty cabinets is a particularly strong element: it has the highest correlations with the other variables. This finding is of great theoretical interest because, as argued earlier (in the beginning of Chapter 5), this variable can be seen as conceptually close to the essence of the distinction between concentration of power and the joint exercise of power. The effective number of parliamentary parties is a second key component in this cluster. In the second cluster, the federalism and decentralization variable emerges as the strongest element. This finding is theoretically significant, too, because this variable can be seen as conceptually at the heart of the federal-unitary dimension.
An even better and more succinct summary of the relationships among the ten variables can be achieved by means of factor analysis. The general purpose of factor analysis is to detect whether there are one or more common underlying dimensions among several variables. The factors that are found can then be seen as “averages” of the closely related variables. Table 14.2 presents the results of the factor analysis of our ten basic variables. The values that are shown for each variable are the factor loadings, which may be interpreted as the correlation coefficients between the variable and the first and second factors detected by the factor analysis. The same two clusters emerge prominently from this analysis; they are also clearly separate clusters, because the factor analysis used an orthogonal rotation, which guarantees that the two factors are completely uncorrelated.
Varimax orthogonal rotated matrix of the ten variables distinguishing majoritarian from consensus democracy in 36 democracies, 1945–2010

The factor loadings are very high within each of the two clusters and much lower—lower than 0.10 in seven of the ten cases— outside the clusters. The percentage of minimal winning oneparty cabinets again turns out to be the strongest variable in the first dimension: its factor loading of 0.92 means that it almost coincides with the factor. The effective number of parties is an almost equally strong element with a factor loading of −0.91. And the federalism variable emerges once more as the strongest element in the second dimension with an extremely high factor loading of 0.98. The remaining factor loadings within the two clusters are lower but still strong: the lowest is still an impressive 0.53.
THE CONCEPTUAL MAP OF DEMOCRACY
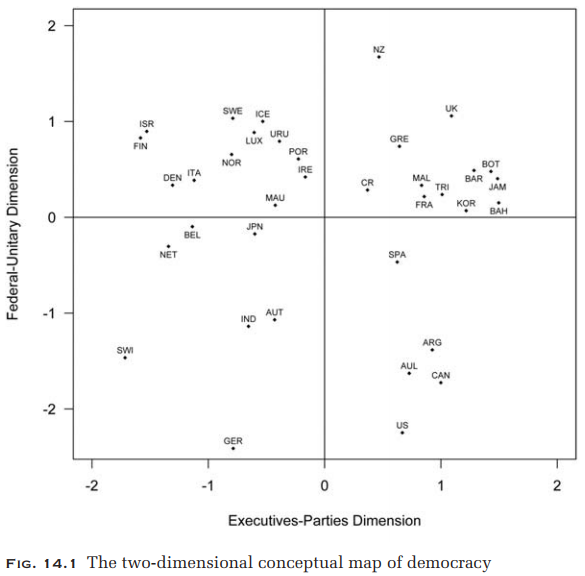
The two-dimensional pattern formed by the ten basic variables allows us to summarize where the thirty-six individual countries are situated between majoritarian and consensus democracy. Their characteristics on each of the two sets of five variables can be averaged so as to form just two summary characteristics, and these can be used to place each of the democracies on the two-dimensional map of democracy shown in Figure 14.1.[1] The horizontal axis represents the executives-parties and the vertical axis the federal-unitary dimension. Each unit on these axes represents one standard deviation: high values indicate majoritarianism and low values consensus. On the executives-parties dimension, all countries are within two standard deviations from the middle; on the federal-unitary dimension, two countries— Germany and the United States—are at the greater distance of almost two and a half standard deviations below the middle. The exact scores of each of the thirty-six countries on the two dimensions can be found in the Appendix.[2]
[1]. In order for the five variables in each of the two clusters to be averaged, they first had to be standardized (so as to have a mean of 0 and a standard deviation of 1), because they were originally measured on quite different scales. Moreover, their signs had to be adjusted so that high values on each variable represented either majoritarianism or consensus and low values the opposite characteristic; for the purpose of constructing the conceptual map, I arbitrarily gave the high values to majoritarianism (which entailed reversing the signs of the effective number of parties and of all five variables in the federal-unitary dimension). After averaging these standardized variables, the final step was to standardize the averages so that each unit on the two axes represents one standard deviation.
[2]. Note, however, that in the Appendix all values on the two dimensions are expressed in terms of degrees of consensus democracy; these can be converted easily into degrees of majoritarian democracy by reversing the signs.
Most of the prototypical cases of majoritarian and consensus democracy discussed in Chapters 2 and 3 are in the expected positions on the map. The United Kingdom and New Zealand are in the top right corner. The United Kingdom is considerably more majoritarian on the executives-parties dimension, mainly because New Zealand, after a long period of being roughly equal in this respect, became considerably less majoritarian after its first PR election in 1996. But New Zealand is a great deal more majoritarian—that is, unitary—on the federal-unitary dimension. Until 1996, therefore, New Zealand’s position was more extreme than that of the United Kingdom—in line with the proposition that it was the purer example of the Westminster model. Chapter 2 used Barbados as an exemplar of majoritarian democracy on the executives-parties dimension only and not as typically majoritarian on the federal-unitary dimension; its location below the United Kingdom and New Zealand but also somewhat farther to the right fits this description well. Switzerland is, as expected, in the bottom left corner but not quite as far down as several other federal democracies, mainly due to its one nonconsensual characteristic—the absence of judicial review. It is still the clearest consensual prototype, however, because it is more than one and a half standard deviations away from the center on both dimensions, whereas Germany—which the map suggests could also have served as the prototype—is located farther down but less than one standard deviation left of the center. Belgium is the one exemplar case not to be in an extreme position, but this is not unexpected either because it only became fully federal in 1993; it does, however, have a strong consensual position on the executives-parties dimension.
The two-dimensional map also reveals prototypes of the two combinations of consensus and majoritarian characteristics. In the top left corner, Israel represents the combination of consensus democracy on the executives-parties dimension (in particular, frequent oversized coalition cabinets, multipartism, highly proportional PR elections, and interest group corporatism) but, albeit somewhat less strongly, majoritarianism on the federalunitary dimension (an unwritten constitution and a unicameral parliament, moderated, however, by intermediate characteristics with regard to federalism and central bank independence). In the bottom right-hand corner, Canada is the strongest candidate for the opposite prototype of majoritarianism on the executives- parties and consensus on the federal-unitary dimension: on one hand, dominant one-party cabinets, a roughly two-and-a-half party system, plurality elections, and interest group pluralism, but on the other hand, strong federalism and judicial review, a rigid constitution, an independent central bank, and bicameralism, albeit of only medium strength (Studlar and Christensen 2006). The United States is located in the same corner and is stronger on the federal-unitary dimension—but not exceptionally majoritarian on the executives-parties dimension, especially due to its lower degree of executive dominance in comparison with Canada.
EXPLANATIONS
Are any general patterns revealed by the distribution of the thirty-six democracies on the map? Is there, for instance, any correspondence between the conceptual and geographical maps? There does appear to be such a relationship as far as the consensus side of the executives-parties dimension is concerned: most continental European countries are located on the left side of the map, including the five Nordic countries, which have been called “the consensual democracies” with a “distinctively Scandinavian culture of consensus and . . . structures for conciliation and arbitration” (Elder, Thomas, and Arter 1988, 221). On the righthand side, the four Caribbean countries are close together, but most of the other countries are geographically distant from one another. The striking feature that many countries on the righthand side of the conceptual map do have in common is that they are former British colonies. In fact, it is the presence or absence of a British political heritage that appears to explain the distribution on the left and right side of the executives-parties dimension better than any geographical factor. Dag Anckar (2008) finds the same strong influence of the British model in his comparative study of democratic “microstates” with populations below one million— including five of our democracies with populations over a quarter of a million as well as twenty-four smaller countries.
There are several obvious exceptions to this twofold division based on the influence of a British heritage. Two of the Latin American democracies—Argentina and Costa Rica—form one exception. Other notable exceptions are Greece, Spain, and, farther to the right, Korea and France. France is an especially interesting exceptional case: in view of French president de Gaulle’s deeply felt and frequently expressed antagonism toward les anglo-saxons, it is ironic that the republic he created is the most Anglo-Saxon of any of the continental European democracies. There are exceptions on the left side of this dimension, too: Ireland, India, Israel, and Mauritius all emerged from British colonial rule. Ireland is only slightly to the left of the dividing line, and what unites the other three countries is that they are plural societies—suggesting that the degree of pluralism is what explains why countries are consensual rather than majoritarian on the executives-parties dimension. Of the seventeen plural and semiplural societies listed in Table 4.3, eleven are located on the left side of the map.
Regression analysis confirms that both explanations are important but also that British political heritage is the stronger influence. The correlation between British heritage—a dummy variable with a value of one for Britain itself and for the fourteen countries it formerly ruled, and zero for the other twenty-one countries—and majoritarian democracy on the executives-parties dimension has a coefficient of 0.50 (significant at the 1 percent level); the correlation with degree of plural society—plural versus semiplural versus nonplural—is −0.30 (significant at the 5 percent level). When both of the independent variables are entered into the regression equation, the multiple correlation coefficient is 0.60 (significant at the same levels). Finally, in a stepwise regression analysis, British heritage explains 23 percent of the variance in majoritarian democracy, and the degree of pluralism adds another 9 percent for a total of 32 percent of the variance explained (measured in terms of the adjusted R-squared).[3]
[3]. It can be argued that three additional countries—Austria, Germany, and Japan—should also be coded as having had a strong degree of British, or rather Anglo-American, influence on their political systems. The postwar Japanese constitution was drafted by General Douglas MacArthur’s staff and was largely inspired by the British model. American and British occupation authorities also oversaw the reestablishment of democracy in Germany and Austria, and they had an especially strong and direct hand in the shaping of the postwar German democratic system (Muravchik 1991, 91–114). However, assigning these three countries a code of 1 on the British heritage variable weakens all of the correlations; for instance, the total variance explained goes down from 32 to 21 percent.
The degree to which countries are plural societies also appears to explain the location of the thirty-six democracies on the federal-unitary dimension. Of the twelve countries situated below the middle, nine are plural or semiplural societies. An additional explanation suggested by the map is population size. The four largest countries—India, the United States, Japan, and Germany— are all located in the bottom part of the map, and of the sixteen countries with populations greater than ten million, ten are in the bottom part. This potential explanation is bolstered by Robert A. Dahl and Edward R. Tufte’s (1973, 37) finding that size is related to federalism and decentralization, the key variable in the federalunitary dimension: “the larger the country, the more decentralized its government, whether federal or not.”
Regression analysis again confirms both of these impressions. The correlation coefficients are −0.53 for population size (logged) and −0.38 for degree of pluralism (significant at the 1 and 5 percent level, respectively). In the multiple regression, both remain significant explanatory variables (although pluralism only at the 10 percent level), and the multiple correlation coefficient is 0.58. Population size by itself explains 26 percent of the variance, and pluralism adds another 4 percent for a total of 30 percent explained variance. The degree of pluralism is again the weaker variable, but it can be regarded as the strongest overall explanation because it can explain a significant portion of the variation in the locations of the thirty-six democracies on both dimensions.[4] Although the joint-power and divided-power aspects of consensus democracy are conceptually and empirically distinct dimensions, they represent complementary institutional mechanisms for the accommodation of deep societal divisions. This finding strengthens Sir Arthur Lewis’s recommendation, stated in Chapter 3, that both dimensions of consensus democracy—in particular, Lewis advocates power-sharing cabinets and federalism—are needed in plural societies.
[4]. British political heritage is not related to the second dimension. Neither is population size related to the first dimension—contradicting Dahl and Tufte’s (1973, 91) argument that “the small system, being more homogeneous, is . . . likely to be more consensual [and that] the larger system, being more heterogeneous, is . . . likely to be more confl ictual.”
SHIFTS ON THE CONCEPTUAL MAP
The locations of the thirty-six democracies on the conceptual map are average locations over a long period: more than sixty years for the twenty older democracies and a minimum of twentytwo years for the three newest democracies (see Table 4.1). These averages conceal any large or small changes that may have taken place. Obviously, political systems can and do change; for instance, in previous chapters I called attention to changes in the party, electoral, and interest group systems of the thirty-six democracies as well as in their degrees of decentralization, the cameral structure of their legislatures, and the activism of their judicial review. To what extent have these changes added up to shifts in the direction of greater majoritarianism or greater consensus on either of both of the dimensions?
To explore this question, I divided the period 1945–2010 in two roughly equal parts: the period until the end of 1980 and the period from 1981 to the middle of 2010. For countries with a sufficiently long time span in the first period, scores on both of the dimensions were calculated for each period. This could be done for the twenty countries covered since the middle or late 1940s and for seven additional countries: Barbados, Botswana, Costa Rica, France, Jamaica, Malta, and Trinidad.[5] The other nine democracies were not included in this part of the analysis. Figure 14.2 shows the shifts that took place in the twenty-seven longerterm democracies from the pre-1980 to the post-1981 period. The arrows point to the positions in the later period. It should be emphasized that these shifts are all relative changes—that is, each country’s change is relative to the changes in all of the other countries. The reason is that the scores on each of the dimensions in each period are standardized and add up to zero; therefore, the shifts from left to right as well as up or down have to sum to zero, too. A good example is the slightly upward shift of the United States in Figure 14.2, which appears to indicate a somewhat less extreme position on the federal-unitary dimension. In fact, however, the absolute position of the United States did not change at all: its scores on all five of the variables in this dimension are exactly the same before 1980 and after 1981. The apparent shift is therefore caused by the sum total of movements in the other twenty-six countries toward a lower position on the federal-unitary dimension. Hence Table 14.2 cannot provide an answer to the question of whether there was any overall tendency toward more majoritarianism or more consensus in the 1945– 2010 period. There is, however, a different way to answer this question, which I shall discuss below.

[5]. These countries are covered starting with the years indicated in Table 4.1. The six countries that became independent and democratic or redemocratized in the 1970s were not included in this analysis because the time span from the beginning of their coverage until 1980 was much too short; the remaining three countries redemocratized after 1981 (see Table 4.1).
The general picture in Figure 14.2 is one of great stability. It shows many relatively small shifts but no radical transformations: not a single country changed from a clearly majoritarian democracy to a clearly consensual democracy or vice versa. There are more shifts from left to right or vice versa than from higher to lower locations or vice versa—a pattern that refl ects the greater stability of the institutional characteristics of the federal-unitary dimension because these are more often anchored in constitutional provisions. Nevertheless, four downward movements stand out. The largest of these refl ects Belgium’s introduction of judicial review in 1984 and full federalism in 1993. The main explanation in the French and Italian cases is the combination of decentralization and stronger judicial review in the second period. The somewhat smaller but still pronounced downward shift in Costa Rica’s position is entirely due to the major change from weak to very strong judicial review in 1989. The still smaller downward movements of Switzerland and Israel are due to the strengthening of their central bank independence. The slight upward movements of many countries do not indicate significant changes because, as in the case of the United States mentioned above, they mainly “compensate” for the significant downward shifts of Belgium, France, Italy, and Costa Rica. However, the adoption of unicameralism in Sweden, Denmark, and Iceland does represent real change and accounts for part of their still relatively small shifts to higher positions in Figure 14.2.
The two big shifts along horizontal lines that stand out in Figure 14.2 are those of our two majoritarian prototypes, New Zealand and the United Kingdom. New Zealand’s shift to a less majoritarian position is the result of its adoption in 1996 of PR, which resulted in less electoral disproportionality, more multipartism, a major increase in coalition and minority cabinets, and lower executive dominance, as discussed in Chapter 2. The leftward shift would obviously be even more pronounced had the comparison been between the periods before and after 1996 instead of before and after 1981. The big move to the right by the United Kingdom occurred in spite of a slight increase in the effective number of parties (from 2.10 to 2.27 parties), which was more than counterbalanced, however, by a big increase in disproportionality (from 8.97 to 16.0 percent) and a higher degree of executive dominance. These changes demonstrate that by 2010 the United Kingdom had definitely replaced New Zealand as the closest approximation of the Westminster model. The next two notable shifts are those of Norway and Ireland. Norway moved to more consensual characteristics on four of the five variables in the executives- parties dimension and maintained its high degree of corporatism at the same level. Ireland crossed over from majoritarian into consensual territory in spite of slightly less proportional election results, but increases in multipartism, coalition government, and corporatism, as well as a decrease in executive dominance (Bulsara and Kissane 2009). The other movements from right to left and vice versa are all smaller and refl ect a variety of changes in the five variables underlying the executives-parties dimension without any one of these variables standing out as the most influential.
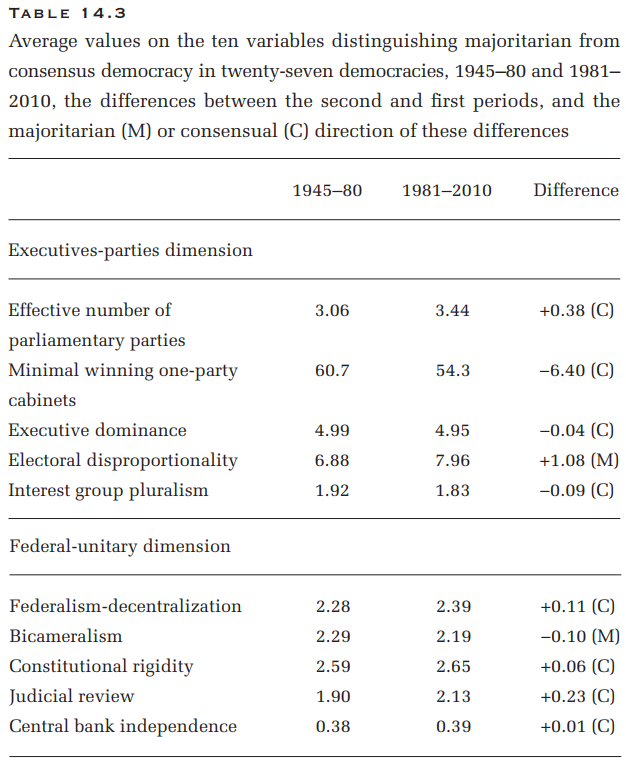
In order to discover whether there was any general trend toward more majoritarianism or consensus on the two dimensions, we need to look at the average unstandardized scores on each of the ten basic variables. These averages are presented in Table 14.3. The table also shows the differences between the secondperiod and first-period scores and whether these differences indicate more majoritarianism or more consensus. On eight of the variables, the trend is toward greater consensus, but only three of these show sizable differences: more multipartism (by about an extra one-third of a party), more than 10 percent fewer minimal winning one-party cabinets, and stronger judicial review. Of the two variables that show the opposite trend, only the increase in electoral disproportionality—by more than one percentage point— is an impressive change. The overall trend is toward more consensus democracy, but it is obviously not a very strong trend.
Average values on the ten variables distinguishing majoritarian from consensus democracy in twenty-even democracies, 1945–80 and 1981–2010, the differences between the second and fi rst periods, and the majoritarian (M) or consensual (C) direction of these differences
The second-period (1981–2010) scores on the two dimensions are used again in the next two chapters. These scores will differ slightly from those of the twenty-seven democracies used to discover shifts on the conceptual map in the last part of the current chapter, because they will be based on the ten standardized variables and two dimensions for both these twenty-seven countries and the nine countries that could not be included for this purpose. The next two chapters analyze the consequences that type of democracy may have for the effectiveness, democratic character, and general policy orientation of governments. Reliable data on these variables are generally available only for recent decades; moreover, focusing on the more recent period enables us to include as many of the thirty-six democracies as possible in the analysis. It therefore also makes sense to measure the degrees of consensus or majoritarianism of the twenty-seven longer-term democracies in terms of their characteristics in the second period.
반응형


